

FineArts Restoration, Data-intelligence platform that uncovers revenue patterns hidden in CRM data
Centralized sales and communication data gives the team actionable revenue insight and closes the blind spots between CRM and workspace tools.
Project Overview
FineArts Restoration runs a sales motion that touches a CRM, email, calendar, billing, and shared docs. Each tool holds a slice of the customer story. We built a data intelligence platform on Google Cloud that pulls those slices into one warehouse and surfaces the revenue patterns the team could not see before.
Client Background
FineArts Restoration is a sales-led business that works with a steady book of accounts. The revenue team uses a CRM for deal tracking, workspace tools for daily collaboration, and a billing system for recurring revenue. Like most teams at this scale, the data is correct in each tool but fragmented across all of them. Leadership wanted a single source of truth for revenue signal, not another dashboard layered on top of the tools.
The Problem
Sales and revenue data lived in fragments. The CRM held the deals. Email held the conversations. The calendar held the meeting cadence. Billing held the recurring revenue. No tool showed how those signals connected.
That gap had practical costs. Reps could not see which communication patterns preceded a closed deal versus a churned one. Managers could not tell where pipeline was leaking. Leadership could not point to specific behaviors that moved the number. Decisions were based on what someone happened to remember from a recent week.
Challenges
- Each source system had its own schema, identifiers, and update cadence.
- Contacts and accounts had to be reconciled across CRM, email, and billing where IDs did not match.
- API rate limits on workspace tools made full history backfills slow and easy to break.
- Schema drift in the CRM, custom fields and pipeline stages, had to be handled without re-engineering every change.
- Pattern analysis only works if the underlying joins are trustworthy, so data quality had to come first.
Our Approach
We started by mapping where revenue signal actually lived. That meant tracing a real deal from first email to closed invoice and listing every system touched along the way. From there we picked the smallest set of sources that covered the full deal lifecycle.
Next we designed the ingestion layer with two goals: keep each source isolated so a broken API does not stall the whole platform, and write to a warehouse model that makes joins across systems straightforward. Pattern analysis came last, on top of clean joined data, not bolted onto raw exports.
What We Built
Integrations
ETL pipelines pull from the CRM and workspace tools on a regular cadence. Each source has its own ingestion job, its own retry logic, and its own schema mapping. New fields in the CRM can be added without rewriting downstream jobs.
Data Foundation
A warehouse on Google Cloud holds the normalized data. Contacts, accounts, deals, communications, meetings, and billing events all map to a shared model. Identity resolution stitches the same person and account across systems so queries return one answer, not three.
Pattern Analysis
The analysis layer looks for correlations between behavior and revenue outcomes. Examples include communication frequency before a close, meeting cadence on at-risk accounts, and billing patterns that precede churn. The output is specific signal, not a wall of charts.
Sales Insight View
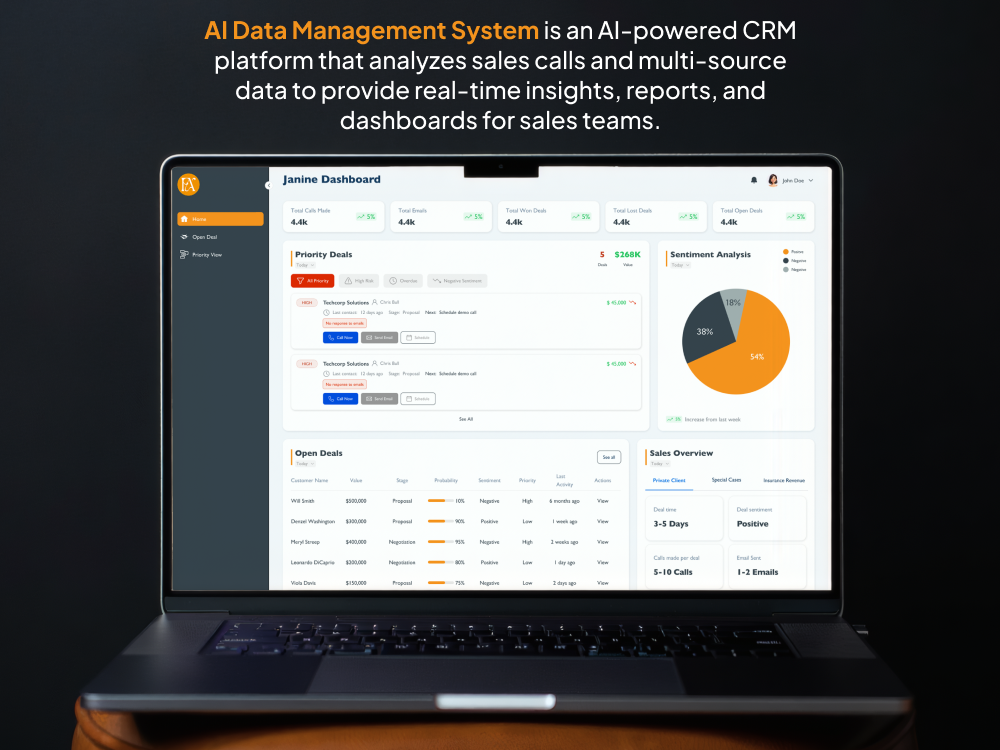
A focused UI shows reps and managers the patterns that matter for the accounts in front of them. The point is to drive a next action, not to admire a dashboard.
Reporting
Aggregated views give leadership a read on pipeline health, communication coverage, and revenue concentration without exporting CSVs from four tools.
Technical Architecture
The platform has three layers: ingestion, warehouse, and analysis. Ingestion runs on Google Cloud and treats each source as an isolated pipeline. The warehouse holds the unified model. The analysis layer reads from the warehouse and serves the insight UI.
Key Decisions
- Centralize first, analyze second. We chose to build a real warehouse instead of point-to-point integrations. That delayed visible features by a few weeks but made every later question cheaper to answer.
- Pick Google Cloud as the foundation. The team did not want to manage infrastructure. GCP gave us managed services for storage, scheduling, and compute without standing up an ops function.
- Treat each source as isolated. Every connector has its own job and its own schema map. We gave up some shared code in exchange for fault isolation when an upstream API changes.
- Build identity resolution into the warehouse. We took on the cost of matching contacts and accounts across systems because pattern analysis is worthless without trustworthy joins.
- Ship actionable signal, not raw dashboards. We picked a smaller set of recommendations over a wider set of charts so reps would actually use the tool.
Results
The team works from one unified view instead of triangulating across the CRM, inbox, calendar, and billing system. Account reviews are faster because the relevant history is in one place. Managers can see which patterns precede closed deals and which ones precede churn. Revenue blind spots that used to require a manual data pull now surface on their own.
Project Highlights
- Centralized CRM and workspace data into one warehouse on Google Cloud.
- Built isolated ETL pipelines that tolerate schema drift and API limits.
- Added identity resolution so cross-system joins are trustworthy.
- Surfaced revenue patterns the team could not see in any single tool.
- Delivered a focused insight UI that drives a next action.
Screens and User Flows
The core flow is the account review. A rep opens an account, the insight view pulls signals from the warehouse, the pattern engine ranks them, and the rep gets a small set of recommended next actions.
Future Growth Opportunities
- Add forecasting on top of the unified model now that the joins are trustworthy.
- Expand the source list to support tools (chat, support, product analytics) without rewriting the warehouse.
- Layer in account scoring driven by the pattern engine.
- Open a read-only API so other internal tools can consume the unified data.
- Add anomaly alerts when communication or billing patterns shift on a key account.

Want one of these for your team?
45-min call, fixed quote in 72 hours, code in production by week 4.
Core MVP shipped to production by week 4.
or send a 2-min Loom →or email hello@obsidiancode.io