

Catalyser, AI-enabled analytics for large-scale fundraising
Natural-language analytics over a large fundraising organization's financial data, ask questions, get visualizations, automate reports.

Project Overview
Catalyser is an AI-enabled analytics platform for a large fundraising organization. Leaders and program owners ask questions about donors, campaigns, and costs in plain English, get charts back, and schedule the answers as recurring reports. We delivered the platform end to end, from data model to chat interface.
Client Background
Catalyser operates in the fundraising and nonprofit finance space. The team manages years of donor and campaign data across multiple programs. Strategy, fundraising, and finance leaders depend on this data to plan quarters, justify spend, and report to boards. Until now, every meaningful question went through a small analyst team.
The Problem
Fundraising organizations sit on rich datasets: donor history, campaign performance, cost trends, and attribution. Strategic questions like "which donor segments drove this quarter's growth?" or "which campaigns are losing money?" need answers in hours, not weeks. SQL was the bottleneck. Leaders filed tickets, analysts cleared a backlog, and decisions waited in the queue.
The cost was not just speed. When questions are expensive to ask, fewer get asked. Teams stop exploring and start guessing.
Challenges
- Mixed and evolving schema across donor, campaign, and finance tables, with naming inconsistencies built up over years.
- Ambiguity in natural language. A question like "top campaigns last quarter" can mean revenue, ROI, or new donors acquired.
- Trust. Leaders will not act on a chart they cannot trace back to a query.
- Performance over a large historical dataset without slowing the UI to a crawl.
- Permission boundaries between fundraising, finance, and program leads.
- Recurring reports needed to keep working as the underlying data changed week to week.
Our Approach
We started with the question, not the model. We sat with the analyst team and listed the questions that consumed the most ticket time. That gave us a shortlist of intents, entities, and metrics the platform had to answer well on day one.
From there, we shaped a small semantic layer in Postgres: clean views over the messy source tables, with names, units, and grain that match how the business talks. Natural-language input gets translated against that layer, not the raw schema. SQL is generated, validated, run, and shaped with Pandas before the result becomes a chart.
Delivery moved in stages: data model first, then a working chat interface against a narrow set of questions, then chart presentation, then scheduled reports. Each stage went in front of real users before we widened scope.
What We Built
User Experience
A chat-style interface where users type questions in plain English. The platform shows the chart, a short summary, and the underlying query so users can verify what was asked. Saved questions can be pinned, shared, or scheduled.
Reporting and Automation
Any question can become a recurring report. Schedules run server side, snapshot the result, deliver it, and keep a history so leaders can see how a number moved over time.
Visualization
Results render as charts that match the shape of the question: trend lines for time series, bar charts for comparisons, tables when detail matters more than shape. Defaults are chosen automatically, with a manual override.
Admin Operations
Admins manage the semantic layer: which views exist, what each field means, and which roles can query what. New questions get answered better as the semantic layer grows, without code changes.
Performance
Heavy aggregations run in Postgres. Pandas handles shaping, formatting, and lightweight derived fields. Schedules run off the request path so the UI stays responsive.
Technical Architecture
The system has four layers: a Next.js frontend, a FastAPI service, a natural-language to SQL layer that targets a curated semantic view, and a Postgres database hosted on Supabase. Pandas sits in the API service for result shaping and report formatting.
The Next.js app handles auth, chat UI, chart rendering, and report management. FastAPI handles question parsing, query generation, validation, and result shaping. Postgres on Supabase stores both the source data and the semantic views the query layer targets.
Key Decisions
- FastAPI over a Node backend. We needed Pandas in-process for shaping and a clean fit with the query and validation logic. We gave up some shared types with the frontend, which we covered with a thin schema contract.
- Postgres on Supabase instead of a separate warehouse. The dataset is large but fits comfortably in Postgres with proper indexes and materialized views. We gave up some warehouse-grade analytics features we did not need yet.
- A curated semantic layer instead of pointing the model at raw tables. Accuracy and trust matter more than coverage on day one. We gave up the ability to answer every possible question immediately; we gained answers leaders are willing to act on.
- Show the generated SQL in the UI. Some teams hide it. We chose visibility so analysts can audit results and educate users over time.
Results
Fundraising leadership now asks their own questions and gets answers back as charts, without filing analyst tickets for routine work. Recurring reports run on schedule instead of being rebuilt by hand each cycle. The analyst team has shifted from clearing a backlog of one-off requests to higher-value modeling and validation work. Decisions that used to wait now move at the pace of the meeting they came up in.
Project Highlights
- Natural-language analytics over a real fundraising dataset, in production.
- Curated semantic layer that keeps answers explainable and traceable.
- Scheduled reports replace manual recurring work.
- Generated SQL visible in the UI so results stay auditable.
- Architecture that scales from chat questions to scheduled jobs on the same data model.
Screens and User Flows
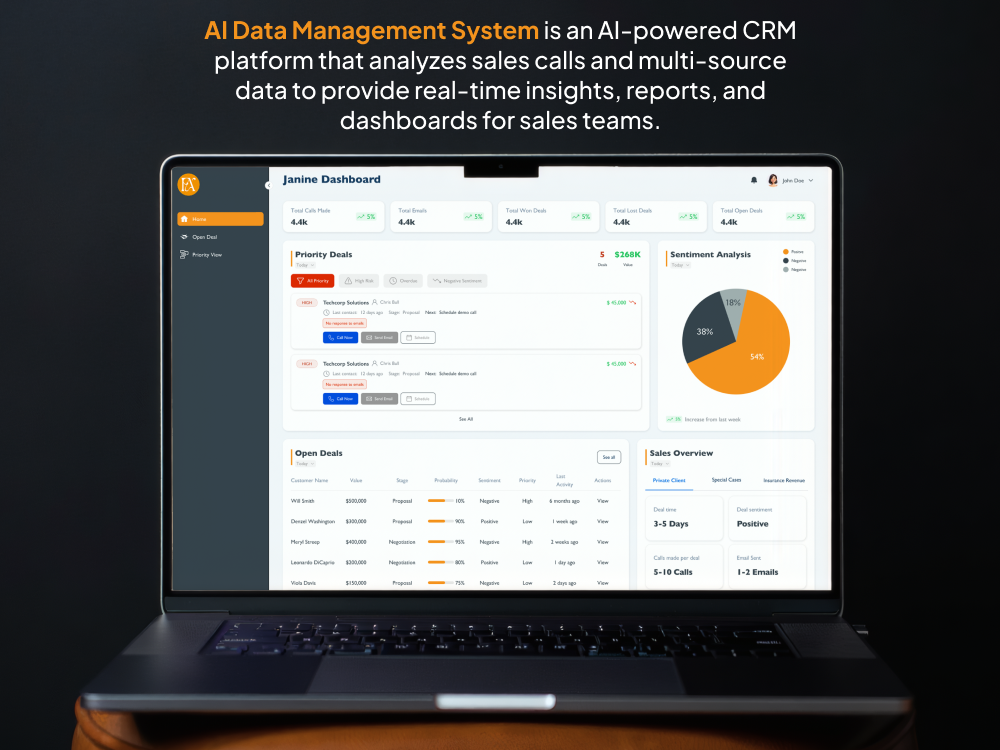
The core flow is question to chart to saved report. A user types a question, the API translates it against the semantic layer, runs the query, shapes the result, and returns a chart with a short summary. The user can save the question, share it, or put it on a schedule.
Future Growth Opportunities
- Cohort and segmentation tools layered on top of the semantic views, without changing the query interface.
- Anomaly alerts on scheduled reports, surfacing significant shifts in donor or campaign metrics.
- Forecasting on campaign revenue and cost trends, using the same data model.
- Role-aware views so finance, fundraising, and program leads see the cuts that matter to them by default.
- An export and embed path so charts can flow into board decks and partner updates without re-keying.
Want one of these for your team?
45-min call, fixed quote in 72 hours, code in production by week 4.
Core MVP shipped to production by week 4.
or send a 2-min Loom →or email hello@obsidiancode.io